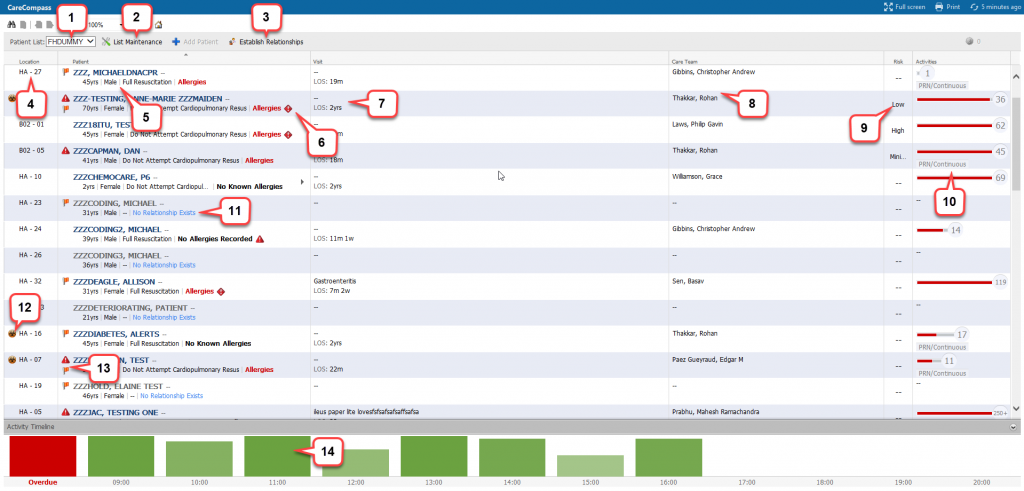
How to use CareCompass to access patient records and manage patient care.
Patient List selection drop-down. For information about how to set up a patient list see Patient Lists.
List Maintenance button – this will open the Modify Patient Lists window to allow you to set up or modify patient lists.
Establish Relationships button – this will open theEstablish Relationships window to allow you to establish clinical relationships with multiple patients at once.
Location column – shows the current location of the patient on the ward.
Patient Name and demographic information (including resuscitation status). Click the patient name to open the patient record. Hovering your mouse over this area will display more information including the patient MRN.
Allergy information. If allergies have been documented then this will display “Allergies” or “No Known Allergies”. Hovering your mouse over this field will display more information about the allergies recorded. If allergies have not been documented this field will display “No Allergies Recorded”. Clicking this will open the allergies window to allow you to document any allergies.
Reason for Visit and Length of Stay. If the reason for visit has been documented it will display here.
Care Team – this will display the attending (lead) clinician for the patient.
Risk level – the most recent documented patient risk level from the eObservations system.
Activities – shows the number of activities or tasks due or overdue for the patient. The line to the left of the number shows the proportion of all tasks that are overdue (red). If the patient has any activities classed as PRN or Continuous (e.g. Food Chart) then this will display under the task counter. Clicking on the number will open the Activities window. For more information see Documenting Tasks/ Activities.
Relationship status – if you do not have a clinical relationship with the patient then it will show here. Click the status to establish a relationship with an individual patient. For more information see Establishing Relationships
Isolation status – hover your mouse over the icon to see more details.
Risk icons. A red triangle indicates that information has been documented on the patient record that presents a risk to the patient for example high BMI or Braden scores. An orange flag indicates a clinical risk.
Activity Timeline – shows a summary of activities/ tasks due by hour. Overdue activities are shown in red on the left. Clicking a column will show a summary of all activities/ tasks due in that hour period. The Activity Timeline can be shown or hidden by clicking the grey title bar above the columns: