More results...
More results...
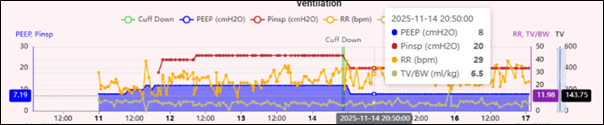
Hovering the pointer over any chart will display detailed information on each axis and a tooltip with the exact figures for that time:
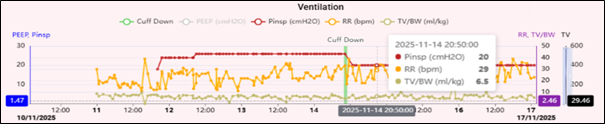
Data series can be removed from view. To do so, click on the colour coded title above the the graph. This will toggle the series on and off, so you can focus on the most relevant patient information:
Tables display data from the time point closest to the time in the heading column. Hovering over a box will display the detailed information:
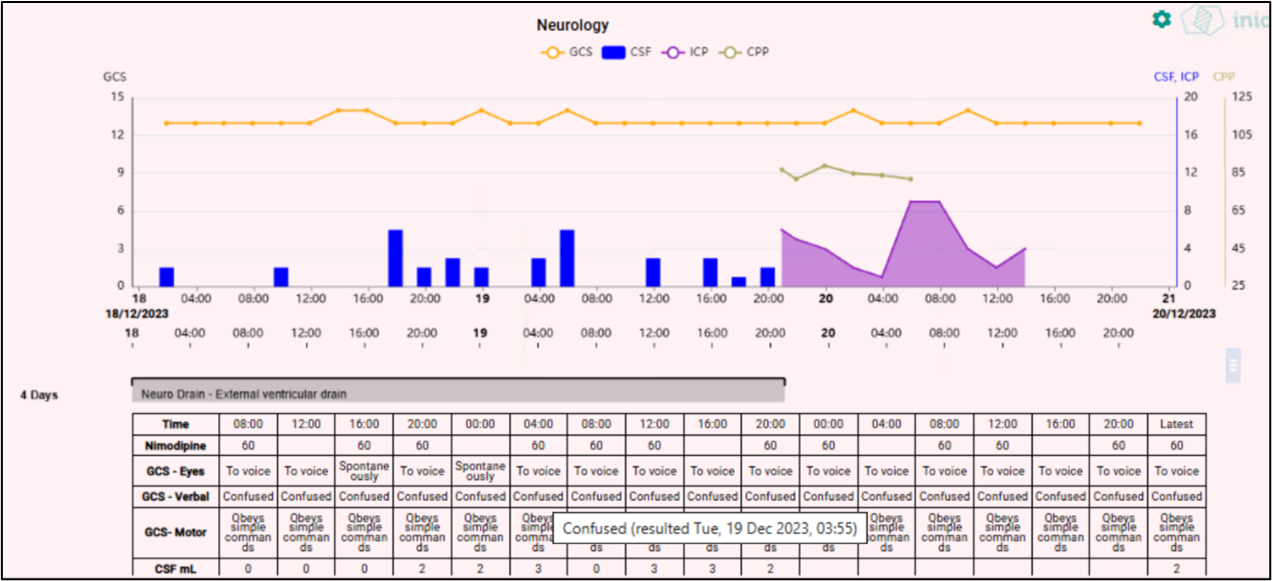
Tables have a summary column on the right with shows the most resent result for each row.
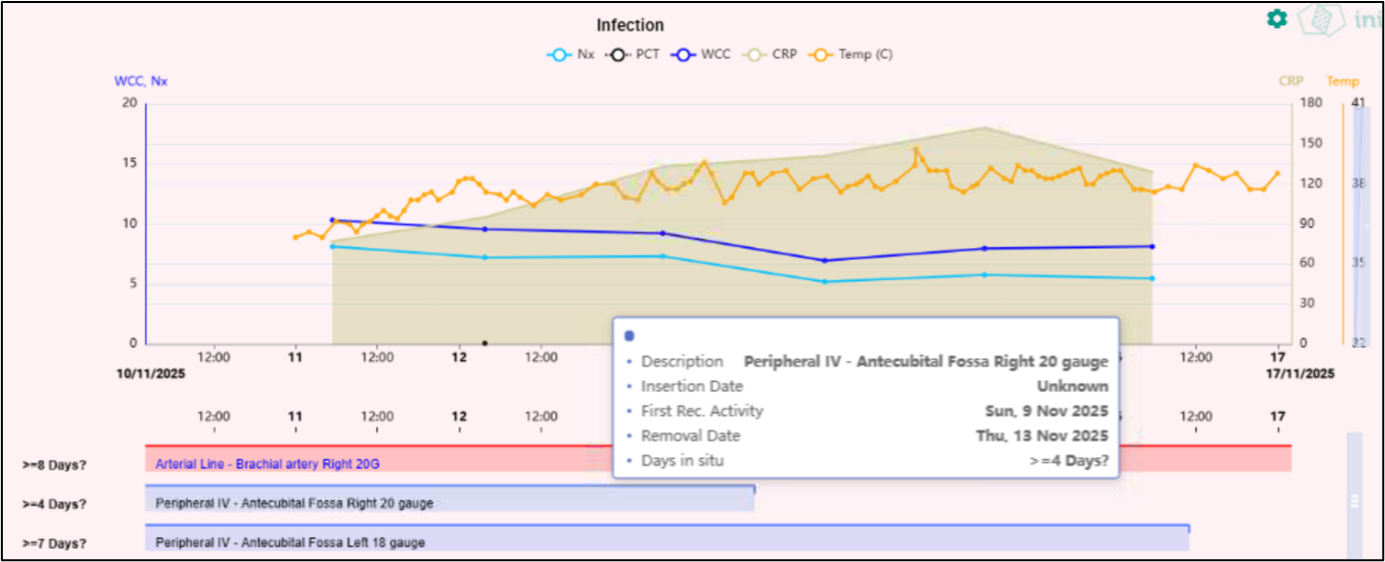
Lines, drains and tubes are displayed in relevant systems. They display as a horizontal bar which is colour coded for device type. Duration and descriptor information is provided to the left of the bar:
![]()
The coloured section has a border which wraps around the bar at the time when insertion have been documented. The border wraps around at the end to demonstrate when the removal has been documented. If the “wrap around” is not visible at the start, then it was started before the time currently shown. If the “wrap around” is not visible at the end, then the device is still inserted in the patient.
Hovering over a line/drain/tube will show a tooltip with relevant information: